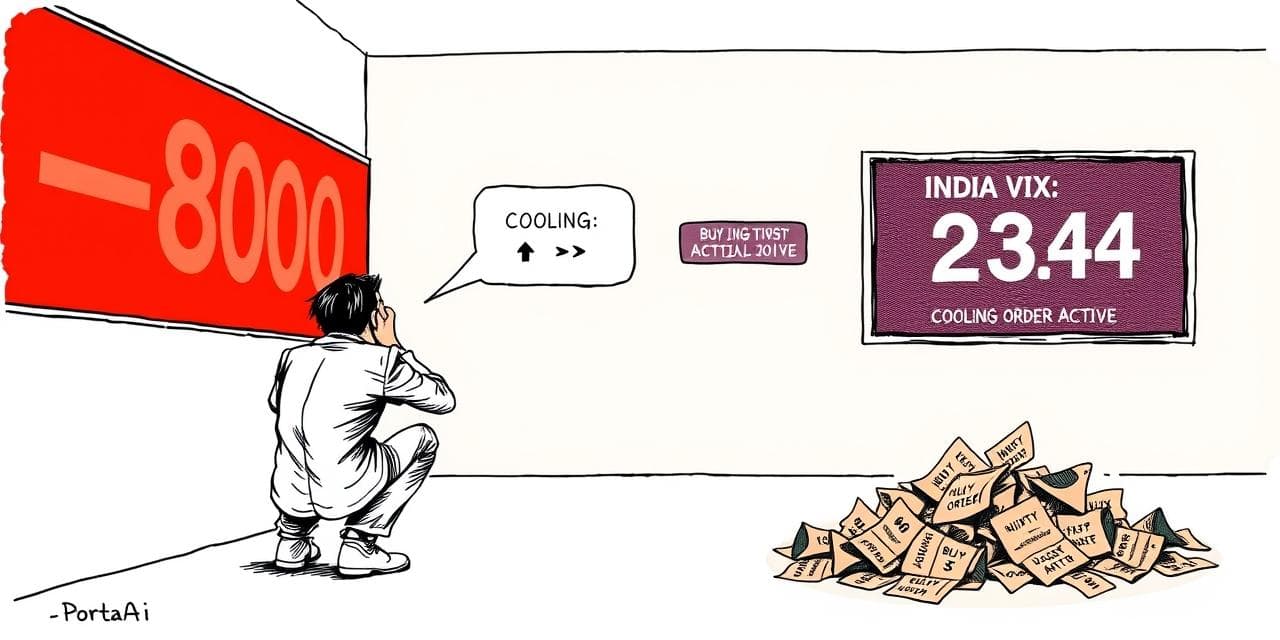
Two numbers appeared on your screen last week. Nifty: down 800 points. India VIX: 23.4.
The first one made you anxious. The second one, if you even noticed it, probably confused you.
You should have paid more attention to the second one.
The Nifty number tells you what already happened. The VIX tells you what the market expects next. And right now, after India VIX surged 39% in the first two weeks of March driven by crude oil hitting $120 and FPIs selling ₹52,704 crore, it is telling you something specific. Most retail investors are misreading it badly.
What India VIX at 23 Is Actually Measuring
India VIX is not a price. It is a forecast of volatility.
NSE calculates it from the bid-ask prices of Nifty options expiring in the next 30 days. When options traders expect large swings, they pay more for both calls and puts. That premium gets reflected as a higher VIX reading. The index does not predict direction. It predicts magnitude.
At 23, options traders are pricing in daily Nifty moves of roughly 1.4% in either direction over the next month. That is elevated uncertainty. Not extreme panic. Below 15 is calm markets. Between 15 and 20 is moderate concern. Above 20 means fear is priced in. Above 30 is the territory of genuine crisis: COVID in March 2020 sent VIX to 83. The 2008 crisis pushed it above 60.
At 23, you are in the "fear zone" but not the "capitulation zone." That distinction matters for what you do next.
The fear zone is uncomfortable. It is also, historically, where money gets made.
What History Says When Nifty VIX Spikes Like This
Analysis from Samco's market research examined every sharp VIX spike in Nifty's history. The finding: Nifty rebounded within 30 days in 75% of extreme VIX spike events. The VIX spike itself was a better buy signal than most technical indicators.
That sounds like strong evidence to buy right now.
Here is the inconvenient part: 25% of the time, the VIX spike was the beginning of a prolonged decline. COVID, 2008, the 2016 demonetisation crash. If you had bought "the dip" at VIX 20 in each of those cases, you watched the market fall another 30-40% before recovering.
You do not know, in real time, whether this is a 75% case or a 25% case.
What you can control is not the timing. It is the structure of what you buy and how much.
What Are the Behavioral Mistakes Indian Investors Make When VIX Spikes?
Nifty was at 26,277 before this crash. Now it is at 24,136. Psychologically, 24,136 "feels cheap" relative to 26,277.
This is anchoring bias. The previous high has no logical connection to fair value. It is just the number your brain remembers most recently. Nifty at 24,000 can be expensive or cheap depending on earnings growth, global rates, and geopolitical conditions. The fact that it was higher three weeks ago tells you nothing about whether it is worth buying today.
The investors who lost the most during the 2008 and 2020 collapses kept buying "cheaper" on the way down, because the stock looked cheap relative to the recent high. Suzlon at ₹300 looked cheap after trading at ₹400. Then it went to ₹150. Then ₹50.
Every Indian retail investor who bought during the March-April 2020 COVID crash made spectacular returns. Nifty at 7,610 on March 24, 2020 hit 18,000 by October 2021. A 136% return in 18 months.
That experience is now hardwired into retail memory. "I bought the dip in 2020 and doubled my money. I will do it again."
The 2020 rebound was the fastest and sharpest recovery in equity market history, driven by an unprecedented global liquidity injection. Central banks cut rates to zero and printed money at a scale never seen before. That exact combination does not exist today: RBI held rates at 5.25%, and inflation from a crude oil shock above $100 does the opposite of enabling cheap money.
Recency bias makes you assume the pattern you saw last time will repeat. Markets do not read your memory.
This is the most expensive mistake and the hardest to see in yourself.
When most retail investors say "I'm buying the dip," what they actually mean is: "I'm adding more of the stocks I already own because they're down." That is not dip-buying. That is averaging down. They are very different things, and the difference shows up clearly in your order history.
Real dip-buying looks like deploying fresh capital into positions you did not previously hold, or into diversified index funds or large-cap stocks you have no existing exposure to. It improves your portfolio's diversity.
Averaging down looks like a fourth lot of Suzlon, a third round of YES Bank, or doubling your Zomato holding after it fell 20%. It concentrates your risk in stocks that are already your biggest pain points.
Your order history tells the story honestly. Most retail investors who think they bought the dip this week added to their most concentrated existing losers. Their portfolio's top-10 holdings are now even more skewed toward the stocks that hurt them most.
How to Tell Which One You're Doing
Dip-buying deploys fresh, unallocated capital into new positions or broad diversification. Averaging down uses existing cash to increase concentration in positions already underwater. Dip-buying lowers your portfolio's overall risk by spreading exposure. Averaging down raises it by betting more on a stock that has already moved against you. The distinction is invisible when you place the order. It becomes visible in your portfolio weight six months later.
Three questions to ask before your next buy during this correction:
- Does this increase my existing position in a stock already down 20%+? If yes, you are averaging down, not buying the dip.
- Is this fresh capital I had planned to deploy, or am I pulling from an emergency fund, FD, or other allocation? If the latter, you are breaking a pre-decided plan under emotional pressure.
- Will this purchase increase my single-stock concentration above 8-10% of my portfolio? If yes, the math works against you even if the stock recovers.
PortoAI's behavioral fingerprint reads your Zerodha and Groww order history and flags which pattern you have been following over the last 12 months. Many investors are surprised to learn that their "strategic dip-buying" history is almost entirely averaging down into existing losers, not fresh diversification.
What a High VIX Period Actually Means for Your SIPs
Here is the good news: if you run SIPs, high VIX is working in your favour right now without you having to do anything.
When Nifty falls 800 points, your monthly SIP instalment buys more units than it did last month. The NAV of your equity fund is lower. Your ₹10,000 SIP bought 100 units last month. This month it will buy 112 units. That compounding of unit accumulation during corrections is the actual mathematical engine behind the "SIPs outperform lump sums" claim.
Investors who stopped SIPs during the Iran conflict last week missed precisely the cheapest buying days of the correction. The instinct to stop paying into a falling market is the most expensive SIP mistake you can make.
The panic-stopping-SIPs behaviour is well documented in AMFI monthly data: SIP registration cancellations spike during sharp market falls and spike again during recoveries when investors "feel ready" to come back. The result is investors systematically buying less during cheap markets and more during expensive ones.
What PortoAI Reads in Your Order History During a Market Panic
When VIX spikes, your behavioral fingerprint changes. The patterns are consistent across retail investors and visible in order data:
Order frequency increases. During fear spikes, the average retail investor places 2-3x their normal number of orders in a week. More decisions made in a state of anxiety means more decisions that deviate from the original plan.
Average order size grows. Averaging-down orders are typically larger than initial buy orders. Investors who are down 30% often put in 1.5-2x their original lot size, increasing exposure to a thesis that is already failing.
Order timing clusters around intraday lows. High-VIX panic-buying often happens in the last 30 minutes of trading when prices look "too cheap to ignore." This is the same window where intraday circuits and institutional selling create false support levels.
PortoAI's overtrading detection and cooling period alert both trigger when you display this pattern. If you have placed three or more trades in the last 48 hours during a market fall, and those trades have increased your allocation in existing underwater positions, a cooling period notification appears. Not to stop you from acting. To ensure your next action is deliberate rather than reactive.
That cooling period, borrowed from research on impulsive trading decisions, is the most effective single intervention for investors in a high-VIX panic cycle.
The One Move That Makes Sense Right Now
Markets with VIX at 23, FIIs selling ₹52,704 crore, and crude still above $88: this is not a moment for large concentrated bets. It is a moment for structured, disciplined, small-lot deployment.
Specifically:
Continue every SIP. Without exception. Your monthly portfolio checkup in April will show you the unit accumulation benefit of not panicking this week.
Review concentration before adding anything. If a single stock already represents more than 8% of your equity portfolio, adding more in a correction is not a brave contrarian move. It is a concentration problem compounding into a larger concentration problem.
Use this correction to fix portfolio structure, not just reduce average costs. If your portfolio is 70% in five high-beta retail favourites, the correction is an opportunity to deploy any new cash into positions that lower your portfolio's beta. Not into the five you already hold.
Ignore the Nifty number. Watch the VIX direction instead. VIX falling from 23 toward 15 is the actual signal that institutional fear is dissipating. That signal will not appear on your broker's home screen. You have to look for it.
See what your dip-buying history actually looks like. Connect your Zerodha or Groww account and let PortoAI show you whether you're buying dips or digging holes.
Try PortoAI FreeFrequently Asked Questions
What does India VIX above 20 mean?
India VIX above 20 signals elevated market fear. The index measures how much volatility options traders expect in Nifty over the next 30 days. Between 15 and 20 is considered moderate uncertainty. Above 20 means options are pricing in sharp swings in either direction. It does not mean the market will fall further. It means uncertainty is high and participants are paying a premium to hedge.
Is India VIX 23 dangerous for the stock market?
Not automatically. VIX at 23 is elevated but not extreme. VIX above 30 signals the kind of panic seen during COVID (March 2020, VIX hit 83) or the 2008 crisis. At 23, markets are fearful but not in freefall. Historical data from Samco shows Nifty rebounded within 30 days in 75% of cases when VIX spiked sharply. The risk is that you are in the 25% case, which is why position sizing matters more than timing.
Should I buy the dip when India VIX is high?
Deploying fresh, pre-allocated capital into diversified positions during a high-VIX period has historically produced strong 12-month returns. The error most retail investors make is not the buying decision itself but what they buy: they add a third or fourth lot of an already-concentrated position in a retail favourite stock rather than using the correction to build a more diversified portfolio. PortoAI's data shows whether your dip-buying is actually improving or worsening your portfolio's risk profile.
What is the difference between dip-buying and averaging down?
Dip-buying means deploying fresh capital into positions you did not previously hold, or into a diversified basket, when prices are lower. Averaging down means adding to a stock you already hold at a loss, with the goal of reducing your average purchase price. Dip-buying improves diversification. Averaging down concentrates risk. The distinction is invisible to most investors because both involve buying a falling market, but one improves your portfolio structure and the other usually makes it worse.
Should I pause my SIP when India VIX is above 20?
No. Pausing your SIP when VIX is high is precisely the wrong move. High-VIX periods mean your SIP is buying more mutual fund units for the same rupee amount. Investors who continued SIPs through the COVID VIX spike of March 2020 bought units at near-decade lows. Those who paused locked themselves out of the recovery and then resumed SIPs at higher prices. VIX is an argument for continuing SIPs, not stopping them.
What is a good India VIX level to start buying?
There is no universally good level. Historically, VIX readings above 20 with a sharp spike from sub-15 levels have marked periods of better-than-average 12-month forward returns in Nifty. But context matters: in 2008 and 2020, VIX stayed elevated for months before the final bottom. A better approach than watching VIX in isolation is to deploy capital in tranches, using a pre-decided allocation plan rather than a gut-feel timing call.